Not too long ago, a co-worker had an issue that he asked me about. The gist of it is, we can have multiple concurrent work items processing for a customer, but we want to limit that number to 2. The development team wanted to make sure that their code was working as expected, but they weren’t sure how they could test it, as work items don’t all start and stop at the same time.
Build Some Sample Data
In order to show you the solution, I want to build up a reasonable sized sample. Any solution looks great when reading five records, but let’s kick that up a notch. Or, more specifically, a million notches: I’m going to use a CTE tally table and load 5 million rows.
I want some realistic looking data, so I’ve adapted Dallas Snider’s strategy to build a data set which approximates a normal distribution.
Because this is a little complicated, I wanted to take the time and explain the data load process in detail in its own post, and then apply it in the follow-up post. We’ll start with a relatively small number of records for this demonstration: 50,000. The reason is that you can generate 50K records almost instantaneously but once you start getting a couple orders of magnitude larger, things slow down some.
Give Me Rows
Getting an arbitrary number of records is easy with a CTE-based tally table. Here we get 50,000 uniquely numbered rows in a trivial amount of time:
DECLARE
	@NumberOfRecords INT = 50000;

WITH
L0 AS(SELECT 1 AS c UNION ALL SELECT 1),
L1 AS(SELECT 1 AS c FROM L0 AS A CROSS JOIN L0 AS B),
L2 AS(SELECT 1 AS c FROM L1 AS A CROSS JOIN L1 AS B),
L3 AS(SELECT 1 AS c FROM L2 AS A CROSS JOIN L2 AS B),
L4 AS(SELECT 1 AS c FROM L3 AS A CROSS JOIN L3 AS B),
L5 AS(SELECT 1 AS c FROM L4 AS A CROSS JOIN L4 AS B),
Nums AS(SELECT ROW_NUMBER() OVER(ORDER BY (SELECT 0)) AS n FROM L5)
SELECT TOP(@NumberOfRecords)
	n
FROM Nums;
The output of this is 50,000 rows with one column called n. It’s not the most creative name but does the trick.
Give Me Random Values
The next thing I need is two random numbers for each of the rows. We’ll get into why I need them in just a moment. For now, I want to point out that calling RAND() twice isn’t a safe bet:

Although that’s not workable, you can still generate random values following a uniform distribution between 0 and 1 using the combination RAND(CHECKSUM(NEWID())):

Because NEWID() gives us a new value for each row, we have a different seed for reach row and a result which looks much better for us.
Converting Uniform To Normal
As mentioned above, Dallas Snider has a great technique for generating random values pulled from something which approximates a normal distribution using T-SQL. But that technique uses a loop and generates two values per loop iteration. In the end, I’m going to want to do this 5 million times, so I’d much rather build a set-based solution.
First, let’s look at Dallas’s solution and see what we need. I’ve simplified the code a bit and formatted it the way I like:
DECLARE
	@randNum1 FLOAT = RAND(),
	@randNum2 FLOAT = RAND(),
	@mean FLOAT = 75.0,
	@stdDev FLOAT = 5.0, --standard deviation
	@precision INT = 1; --number of places to the right of the decimal point

SELECT
	ROUND((SQRT(-2.0 * LOG(@randNum1)) * COS(2 * PI() * @randNum2)) * @stdDev, @precision) + @mean AS Value1,
	ROUND((SQRT(-2.0 * LOG(@randNum1)) * SIN(2 * PI() * @randNum2)) * @stdDev, @precision) + @mean AS Value2;
We end up with something like the following:

Your numbers will, of course differ, but you knew that because you get the idea of random numbers.
So how can we adapt this to our code? Let’s see how.
Getting To The Crux Of Our Problem
Here’s the gist: we have customers with customer IDs. These customers have some data processed. Each time they ask for processing, it takes some number of seconds, but that number can change (maybe the files are different sizes, maybe there’s resource contention, whatever). There will also be delays between executions for each customer, but here’s the important part: a customer can have more than one process running at a time.
So how do we model this idea? With several variables.
DECLARE
	@NumberOfRecords INT = 50000,
	@NumberOfCustomers INT = 150,
	@MeanRunLengthInSeconds DECIMAL(5,2) = 90.0,
	@StdDevRunLengthInSeconds DECIMAL(5,2) = 18.8,
	@MeanLengthBetweenRunsInSeconds DECIMAL(5,2) = 128.0,
	@StdDevLengthBetweenRunsInSeconds DECIMAL(5,2) = 42.3,
	@Precision INT = 1;
In addition to our 50K records, we’ve created 150 customers out of thin air. We have, through studious analysis of our data and totally not just picking a number out of thin air, determined that the mean number of seconds it takes to do this data processing is exactly 90.0, and our standard deviation is 18.8. This data approximates a normal distribution.
In addition, the mean length between runs is 128.0 seconds (again, people in lab coats with Very Serious Glasses and beakers and test tubes and stuff helped us determine this) and the standard deviation for time between runs is 42.3 seconds, and once more, this approximates a normal distribution. Finally, we will ask for precision down to 1 spot after the decimal.
Once I’ve defined those variables and collected those values, I can write a query which gives us realistic-looking values:
DECLARE
	@NumberOfRecords INT = 50000,
	@NumberOfCustomers INT = 150,
	@StartDate DATETIME2(0) = '2018-12-18 15:00:00',
	@MeanRunLengthInSeconds DECIMAL(5,2) = 90.0,
	@StdDevRunLengthInSeconds DECIMAL(5,2) = 18.8,
	@MeanLengthBetweenRunsInSeconds DECIMAL(5,2) = 128.0,
	@StdDevLengthBetweenRunsInSeconds DECIMAL(5,2) = 42.3,
	@Precision INT = 1;

WITH
L0 AS(SELECT 1 AS c UNION ALL SELECT 1),
L1 AS(SELECT 1 AS c FROM L0 AS A CROSS JOIN L0 AS B),
L2 AS(SELECT 1 AS c FROM L1 AS A CROSS JOIN L1 AS B),
L3 AS(SELECT 1 AS c FROM L2 AS A CROSS JOIN L2 AS B),
L4 AS(SELECT 1 AS c FROM L3 AS A CROSS JOIN L3 AS B),
L5 AS(SELECT 1 AS c FROM L4 AS A CROSS JOIN L4 AS B),
Nums AS(SELECT ROW_NUMBER() OVER(ORDER BY (SELECT 0)) AS n FROM L5)
SELECT TOP (@NumberOfRecords)
	n,
	r.CustomerID,
	s.NumberOfSecondsToRun,
	s.NumberOfSecondsBeforeNextRunBegins
FROM Nums
	CROSS APPLY
	(
		SELECT
			RAND(CHECKSUM(NEWID())) AS rand1,
			RAND(CHECKSUM(NEWID())) AS rand2,
			CAST(@NumberOfCustomers * RAND(CHECKSUM(NEWID())) AS INT) + 1 AS CustomerID
	) r
	CROSS APPLY
	(
		SELECT
			ROUND((SQRT(-2.0 * LOG(r.rand1)) * COS(2 * PI() * r.rand2)) * @StdDevRunLengthInSeconds, @Precision) + @MeanRunLengthInSeconds AS NumberOfSecondsToRun,
			ROUND((SQRT(-2.0 * LOG(r.rand1)) * SIN(2 * PI() * r.rand2)) * @StdDevLengthBetweenRunsInSeconds, @Precision) + @MeanLengthBetweenRunsInSeconds AS NumberOfSecondsBeforeNextRunBegins
	) s
And here are some sample results:

The complexity jumped up just a little bit, so let’s walk our way through this. First, I used the CROSS APPLY operator to give me values for rand1 and rand2, as well as a third random value for our Customer ID. I don’t mind Customer ID following a uniform distribution—that might not be perfectly realistic, but it’s close enough for our work. Given 50K records and 150 customers, we’d expect about 333 rows per customer.
Next, I chain the first CROSS APPLY with a second because one good function deserves another. This second function takes Dallas’s calculations and converts them to my own nefarious purposes. Note that instead of having one mean and one standard deviation like in his example, I have two means and two standard deviations.
At this point, I have a few variables for each customer: an implicit ordering (based on n), the number of seconds this particular job will run (NumberOfSecondsToRun), and the number of seconds from now before the next job begins (NumberOfSecondsBeforeNextRunBegins). So now we need to convert this into a stream of time rather than thinking of things as just individual points in time.
Turning Numbers To Time Streams
Let’s pretend that each customer started at time 0. Again, that’s not totally realistic but for our purposes it’ll work just fine. Here’s a quick way to generate a time stream for customer 1:
DECLARE
	@NumberOfRecords INT = 50000,
	@NumberOfCustomers INT = 150,
	@StartDate DATETIME2(0) = '2018-12-18 15:00:00',
	@MeanRunLengthInSeconds DECIMAL(5,2) = 90.0,
	@StdDevRunLengthInSeconds DECIMAL(5,2) = 18.8,
	@MeanLengthBetweenRunsInSeconds DECIMAL(5,2) = 128.0,
	@StdDevLengthBetweenRunsInSeconds DECIMAL(5,2) = 42.3,
	@Precision INT = 1;

WITH
L0 AS(SELECT 1 AS c UNION ALL SELECT 1),
L1 AS(SELECT 1 AS c FROM L0 AS A CROSS JOIN L0 AS B),
L2 AS(SELECT 1 AS c FROM L1 AS A CROSS JOIN L1 AS B),
L3 AS(SELECT 1 AS c FROM L2 AS A CROSS JOIN L2 AS B),
L4 AS(SELECT 1 AS c FROM L3 AS A CROSS JOIN L3 AS B),
L5 AS(SELECT 1 AS c FROM L4 AS A CROSS JOIN L4 AS B),
Nums AS(SELECT ROW_NUMBER() OVER(ORDER BY (SELECT 0)) AS n FROM L5),
Vals AS
(
	SELECT TOP (@NumberOfRecords)
		n,
		r.CustomerID,
		s.NumberOfSecondsToRun,
		s.NumberOfSecondsBeforeNextRunBegins
	FROM Nums
		CROSS APPLY (
			SELECT
				RAND(CHECKSUM(NEWID())) AS rand1,
				RAND(CHECKSUM(NEWID())) AS rand2,
				CAST(@NumberOfCustomers * RAND(CHECKSUM(NEWID())) AS INT) + 1 AS CustomerID
		) r
		CROSS APPLY
		(
			SELECT
				ROUND((SQRT(-2.0 * LOG(r.rand1)) * COS(2 * PI() * r.rand2)) * @StdDevRunLengthInSeconds, @Precision) + @MeanRunLengthInSeconds AS NumberOfSecondsToRun,
				ROUND((SQRT(-2.0 * LOG(r.rand1)) * SIN(2 * PI() * r.rand2)) * @StdDevLengthBetweenRunsInSeconds, @Precision) + @MeanLengthBetweenRunsInSeconds AS NumberOfSecondsBeforeNextRunBegins
		) s
)
SELECT
	v.n,
	v.CustomerID,
	v.NumberOfSecondsToRun,
	v.NumberOfSecondsBeforeNextRunBegins
FROM Vals v
WHERE
	v.CustomerID = 1
ORDER BY
	n ASC
And here are some sample results so we can follow along:

Let’s start at time t=0. If you want to imagine t=0 as a date like 2018-12-18 08:00:00, that’s also fine, but I’m going to stick with numbers representing seconds for the moment.
So we’re at t=0. Then event 20 happens. Customer 1 wants us to process a data file. It’s going to end up taking us 118.7 seconds to process that first data file.
In the meantime, at t=49 seconds, event 88 happens and we process a second file. This one takes 58.4 seconds to run, so it completes at time 107.4.
Then, at t=(49+187.2) or t=236.2, the third file starts. If it helps, I’ve built a number line image below to visualize this:

The main thing we want to see is if there is overlap, and if so, how many concurrent executions we see. In this case, we can see the red and blue lines overlap, but no overlap with green. Therefore, our max number of concurrent executions is 2. We’d want to look at this over the entire stream of time.
The way we can get this is to add one more level of common table expression and introduce a window function with a cutoff:
DECLARE
	@NumberOfRecords INT = 50000,
	@NumberOfCustomers INT = 150,
	@StartDate DATETIME2(0) = '2018-12-18 15:00:00',
	@MeanRunLengthInSeconds DECIMAL(5,2) = 90.0,
	@StdDevRunLengthInSeconds DECIMAL(5,2) = 18.8,
	@MeanLengthBetweenRunsInSeconds DECIMAL(5,2) = 128.0,
	@StdDevLengthBetweenRunsInSeconds DECIMAL(5,2) = 42.3,
	@Precision INT = 1;

WITH
L0 AS(SELECT 1 AS c UNION ALL SELECT 1),
L1 AS(SELECT 1 AS c FROM L0 AS A CROSS JOIN L0 AS B),
L2 AS(SELECT 1 AS c FROM L1 AS A CROSS JOIN L1 AS B),
L3 AS(SELECT 1 AS c FROM L2 AS A CROSS JOIN L2 AS B),
L4 AS(SELECT 1 AS c FROM L3 AS A CROSS JOIN L3 AS B),
L5 AS(SELECT 1 AS c FROM L4 AS A CROSS JOIN L4 AS B),
Nums AS(SELECT ROW_NUMBER() OVER(ORDER BY (SELECT 0)) AS n FROM L5),
Vals AS
(
	SELECT TOP (@NumberOfRecords)
		n,
		r.CustomerID,
		s.NumberOfSecondsToRun,
		s.NumberOfSecondsBeforeNextRunBegins
	FROM Nums
		CROSS APPLY (
			SELECT
				RAND(CHECKSUM(NEWID())) AS rand1,
				RAND(CHECKSUM(NEWID())) AS rand2,
				CAST(@NumberOfCustomers * RAND(CHECKSUM(NEWID())) AS INT) + 1 AS CustomerID
		) r
		CROSS APPLY
		(
			SELECT
				ROUND((SQRT(-2.0 * LOG(r.rand1)) * COS(2 * PI() * r.rand2)) * @StdDevRunLengthInSeconds, @Precision) + @MeanRunLengthInSeconds AS NumberOfSecondsToRun,
				ROUND((SQRT(-2.0 * LOG(r.rand1)) * SIN(2 * PI() * r.rand2)) * @StdDevLengthBetweenRunsInSeconds, @Precision) + @MeanLengthBetweenRunsInSeconds AS NumberOfSecondsBeforeNextRunBegins
		) s
)
SELECT
	v.n AS WorkItemID,
	v.CustomerID,
	v.NumberOfSecondsToRun,
	v.NumberOfSecondsBeforeNextRunBegins,
	SUM(v.NumberOfSecondsBeforeNextRunBegins)
		OVER
		(
			PARTITION BY v.CustomerID
			ORDER BY v.n
			ROWS BETWEEN UNBOUNDED PRECEDING AND CURRENT ROW
		) - v.NumberOfSecondsBeforeNextRunBegins AS TotalNumberOfSeconds
FROM vals v
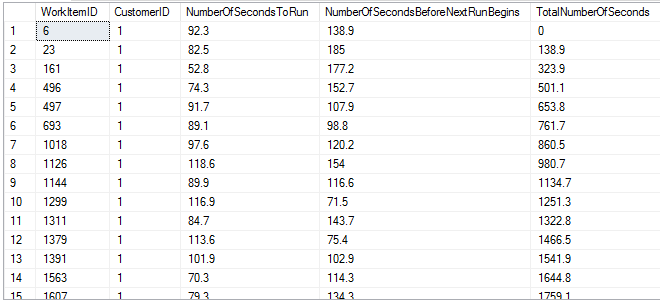
We’ve now included a SUM of NumberOfSecondsBeforeNextRunBegins over a window from the beginning of time up to the current row. But because we’re getting the next run’s start time, we need to subtract out the current row’s value, and that gives us the TotalNumberOfSeconds result which represents where things begin.
Here’s a picture, though note that all of the numbers changed because it’s randomly generated data:
Tying It All Together
So now, armed with these details, we can take the total number of seconds and add it to our start date to get when a work item begins. We can take the work item begin time and add the number of seconds to run, which gives us the work item’s end time.
DROP TABLE IF EXISTS #WorkItems;
CREATE TABLE #WorkItems
(
	WorkItemID INT NOT NULL PRIMARY KEY CLUSTERED,
	CustomerID INT NOT NULL,
	WorkItemStart DATETIME2(0) NOT NULL,
	WorkItemEnd DATETIME2(0) NULL
);

DECLARE
	@NumberOfRecords INT = 50000,
	@NumberOfCustomers INT = 150,
	@StartDate DATETIME2(0) = '2018-12-18 15:00:00',
	@MeanRunLengthInSeconds DECIMAL(5,2) = 90.0,
	@StdDevRunLengthInSeconds DECIMAL(5,2) = 18.8,
	@MeanLengthBetweenRunsInSeconds DECIMAL(5,2) = 128.0,
	@StdDevLengthBetweenRunsInSeconds DECIMAL(5,2) = 42.3,
	@Precision INT = 1;

WITH
L0 AS(SELECT 1 AS c UNION ALL SELECT 1),
L1 AS(SELECT 1 AS c FROM L0 AS A CROSS JOIN L0 AS B),
L2 AS(SELECT 1 AS c FROM L1 AS A CROSS JOIN L1 AS B),
L3 AS(SELECT 1 AS c FROM L2 AS A CROSS JOIN L2 AS B),
L4 AS(SELECT 1 AS c FROM L3 AS A CROSS JOIN L3 AS B),
L5 AS(SELECT 1 AS c FROM L4 AS A CROSS JOIN L4 AS B),
Nums AS(SELECT ROW_NUMBER() OVER(ORDER BY (SELECT 0)) AS n FROM L5),
Vals AS
(
	SELECT TOP (@NumberOfRecords)
		n,
		r.CustomerID,
		s.NumberOfSecondsToRun,
		s.NumberOfSecondsBeforeNextRunBegins
	FROM Nums
		CROSS APPLY (
			SELECT
				RAND(CHECKSUM(NEWID())) AS rand1,
				RAND(CHECKSUM(NEWID())) AS rand2,
				CAST(@NumberOfCustomers * RAND(CHECKSUM(NEWID())) AS INT) + 1 AS CustomerID
		) r
		CROSS APPLY
		(
			SELECT
				ROUND((SQRT(-2.0 * LOG(r.rand1)) * COS(2 * PI() * r.rand2)) * @StdDevRunLengthInSeconds, @Precision) + @MeanRunLengthInSeconds AS NumberOfSecondsToRun,
				ROUND((SQRT(-2.0 * LOG(r.rand1)) * SIN(2 * PI() * r.rand2)) * @StdDevLengthBetweenRunsInSeconds, @Precision) + @MeanLengthBetweenRunsInSeconds AS NumberOfSecondsBeforeNextRunBegins
		) s
),
records AS
(
	SELECT
		v.n AS WorkItemID,
		v.CustomerID,
		v.NumberOfSecondsToRun,
		v.NumberOfSecondsBeforeNextRunBegins,
		SUM(v.NumberOfSecondsBeforeNextRunBegins) OVER (PARTITION BY v.CustomerID ORDER BY v.n ROWS BETWEEN UNBOUNDED PRECEDING AND CURRENT ROW) - v.NumberOfSecondsBeforeNextRunBegins AS TotalNumberOfSeconds
	FROM vals v
)
INSERT INTO #WorkItems
(
	WorkItemID,
	CustomerID,
	WorkItemStart,
	WorkItemEnd
)
SELECT
	r.WorkItemID,
	r.CustomerID,
	s.WorkItemStart,
	DATEADD(SECOND, r.NumberOfSecondsToRun, s.WorkItemStart) AS WorkItemEnd
FROM records r
	CROSS APPLY
	(
		SELECT
			DATEADD(SECOND, r.TotalNumberOfSeconds, @StartDate) AS WorkItemStart
	) s;

SELECT
	wi.WorkItemID,
	wi.CustomerID,
	wi.WorkItemStart,
	wi.WorkItemEnd
FROM #WorkItems wi
ORDER BY
	wi.CustomerID,
	wi.WorkItemID;
There are two things of note here. First, I added a temp table called #WorkItems. Note that if you are not running SQL Server 2016 SP1 or later, you’ll want to comment out the first line. Then, I added an insert statement at the bottom. Here, I start with my records CTE (which we saw above) and used CROSS APPLY to get the work item’s start date. I did that in a CROSS APPLY operation so that I could make the WorkItemEnd calculation easier to follow, saying that we run a certain number of seconds from each work item’s starting point.
This gives us a data set that looks a bit like the following:
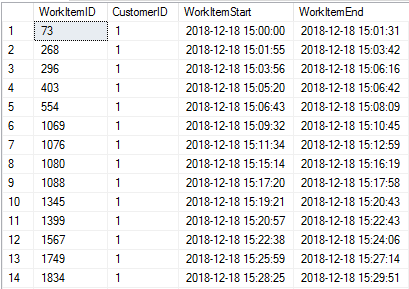
In this run of the job, we can see that work item 296 ends at 3:06 PM, but work item 403 started at 3:05 PM, meaning that there is some overlap. If you briefly glance through these, you’ll see some occasions of overlap but nothing absurd. However, glancing through isn’t enough. That’s where Part 2 comes into play.
Next Time On Matlock
Up to this point, we’ve spent all of our time building up a realistic-enough data set. In tomorrow’s post, we will take this structure, expand it to 5 million rows, and look at a way of finding the max level of concurrency by customer. Stay tuned!

2 thoughts on “Finding Max Concurrent Operations With T-SQL (Part 1)”