This is the final part of a three-part series. In part 1, we built an R model using ML Services. In part two, we saved an R model using ML Services and also showed how to deal with multiple model types. In this final part of the series, we’re going to try getting results for each model we pass in.
Where We Were
If you want to pick up at this point, here’s a quick script to get you back to where we were:
DROP TABLE IF EXISTS #ItemSales;
CREATE TABLE #ItemSales
(
	ItemID INT,
	SaleDate DATE,
	NumberSold INT,
	ShopperQuestions INT,
	EmployeeRecommendations INT,
	InchesOfPrintAdvertisement INT
);

INSERT INTO #ItemSales
(
	ItemID,
	SaleDate,
	NumberSold,
	ShopperQuestions,
	EmployeeRecommendations,
	InchesOfPrintAdvertisement
)
VALUES
	(1, '2017-12-01', 7, NULL, NULL, NULL),
	(1, '2017-12-02', 4, NULL, NULL, NULL),
	(1, '2017-12-03', 4, NULL, NULL, NULL),
	(1, '2017-12-04', 1, NULL, NULL, NULL),
	(1, '2017-12-05', 3, NULL, NULL, NULL),
	(1, '2017-12-06', 3, NULL, NULL, NULL),
	(1, '2017-12-07', 5, NULL, NULL, NULL),
	(1, '2017-12-08', 6, NULL, NULL, NULL),
	(1, '2017-12-09', 2, NULL, NULL, NULL),
	(1, '2017-12-10', 2, NULL, NULL, NULL),
	(1, '2017-12-11', 1, NULL, NULL, NULL),
	(1, '2017-12-12', 4, NULL, NULL, NULL),
	(1, '2017-12-13', 3, NULL, NULL, NULL),
	(1, '2017-12-14', 2, NULL, NULL, NULL),
	(1, '2017-12-15', 3, NULL, NULL, NULL),
	(1, '2017-12-16', 5, NULL, NULL, NULL),
	(1, '2017-12-17', 2, NULL, NULL, NULL),
	(1, '2017-12-18', 5, NULL, NULL, NULL),
	(1, '2017-12-19', 6, NULL, NULL, NULL),
	(1, '2017-12-20', 4, NULL, NULL, NULL),
	(1, '2017-12-21', 5, NULL, NULL, NULL),
	(1, '2017-12-22', 2, NULL, NULL, NULL),
	(1, '2017-12-23', 1, NULL, NULL, NULL),
	(1, '2017-12-24', 3, NULL, NULL, NULL),
	(1, '2017-12-25', 2, NULL, NULL, NULL),
	(1, '2017-12-26', 2, NULL, NULL, NULL),
	(1, '2017-12-27', 2, NULL, NULL, NULL),
	(1, '2017-12-28', 7, NULL, NULL, NULL),
	(1, '2017-12-29', 3, NULL, NULL, NULL),
	(1, '2017-12-30', 5, NULL, NULL, NULL),
	(2, '2017-12-01', 52, 9, 6, 14),
	(2, '2017-12-02', 49, 7, 5, 15),
	(2, '2017-12-03', 53, 13, 6, 14),
	(2, '2017-12-04', 48, 8, 6, 13),
	(2, '2017-12-05', 66, 8, 9, 16),
	(2, '2017-12-06', 58, 8, 8, 15),
	(2, '2017-12-07', 70, 8, 10, 16),
	(2, '2017-12-08', 68, 8, 10, 16),
	(2, '2017-12-09', 43, 12, 3, 14),
	(2, '2017-12-10', 41, 13, 2, 15),
	(2, '2017-12-11', 25, 3, 1, 14),
	(2, '2017-12-12', 42, 2, 4, 15),
	(2, '2017-12-13', 32, 8, 2, 12),
	(2, '2017-12-14', 61, 11, 8, 15),
	(2, '2017-12-15', 58, 14, 6, 16),
	(2, '2017-12-16', 67, 10, 9, 15),
	(2, '2017-12-17', 57, 8, 7, 15),
	(2, '2017-12-18', 49, 8, 6, 13),
	(2, '2017-12-19', 46, 9, 5, 13),
	(2, '2017-12-20', 63, 5, 9, 15),
	(2, '2017-12-21', 45, 9, 4, 15),
	(2, '2017-12-22', 69, 8, 9, 17),
	(2, '2017-12-23', 70, 9, 11, 12),
	(2, '2017-12-24', 70, 2, 12, 14),
	(2, '2017-12-25', 55, 11, 7, 13),
	(2, '2017-12-26', 50, 5, 6, 16),
	(2, '2017-12-27', 64, 11, 9, 13),
	(2, '2017-12-28', 48, 5, 5, 15),
	(2, '2017-12-29', 62, 9, 8, 16),
	(2, '2017-12-30', 50, 4, 6, 15);

DROP TABLE IF EXISTS #Model;
CREATE TABLE #Model
(
	ItemID INT,
	Model VARBINARY(MAX)
);
GO
DECLARE
	@ItemID INT = 1,
	@Model VARBINARY(MAX);

EXEC sp_execute_external_script
	@language = N'R',
	@script = N'
BuildPoisson = function(sales) {
	lambda <- mean(sales$NumberSold)
	class(lambda) <- append("Poisson Distribution", class(lambda))
	return(serialize(lambda, connection = NULL))
}

BuildLinearRegression = function(sales) {
	model <- lm(formula = NumberSold ~ ShopperQuestions + EmployeeRecommendations + InchesOfPrintAdvertisement, data = sales)
	class(model) <- append("Linear Regression", class(model))
	return(serialize(model, connection = NULL))
}

if (mean(Sales$NumberSold) < 6) {
    Model <- BuildPoisson(Sales)
} else {
    Model <- BuildLinearRegression(Sales)
}
',
	@input_data_1 = N'SELECT
	SaleDate,
	NumberSold,
	ShopperQuestions,
	EmployeeRecommendations,
	InchesOfPrintAdvertisement
FROM #ItemSales
WHERE
	ItemID = @ItemID',
	@input_data_1_name = N'Sales',
	@params = N'@ItemID INT, @Model VARBINARY(MAX) OUTPUT',
	@ItemID = @ItemID,
	@Model = @Model OUTPUT;

DELETE
FROM #Model
WHERE ItemID = @ItemID;

INSERT INTO #Model
(
	ItemID,
	Model
)
VALUES
	(@ItemID, @Model);
GO

DECLARE
	@ItemID INT = 2,
	@Model VARBINARY(MAX);

EXEC sp_execute_external_script
	@language = N'R',
	@script = N'
BuildPoisson = function(sales) {
	lambda <- mean(sales$NumberSold)
	class(lambda) <- append("Poisson Distribution", class(lambda))
	return(serialize(lambda, connection = NULL))
}

BuildLinearRegression = function(sales) {
	model <- lm(formula = NumberSold ~ ShopperQuestions + EmployeeRecommendations + InchesOfPrintAdvertisement, data = sales)
	class(model) <- append("Linear Regression", class(model))
	return(serialize(model, connection = NULL))
}

if (mean(Sales$NumberSold) < 6) {
    Model <- BuildPoisson(Sales)
} else {
    Model <- BuildLinearRegression(Sales)
}
',
	@input_data_1 = N'SELECT
	SaleDate,
	NumberSold,
	ShopperQuestions,
	EmployeeRecommendations,
	InchesOfPrintAdvertisement
FROM #ItemSales
WHERE
	ItemID = @ItemID',
	@input_data_1_name = N'Sales',
	@params = N'@ItemID INT, @Model VARBINARY(MAX) OUTPUT',
	@ItemID = @ItemID,
	@Model = @Model OUTPUT;

DELETE
FROM #Model
WHERE ItemID = @ItemID;

INSERT INTO #Model
(
	ItemID,
	Model
)
VALUES
	(@ItemID, @Model);
GO
This will give us two models in the #Model table, one for our fancy watch (ItemID = 1) and one for our less fancy pen (ItemID = 2).
In the previous post, I showed how to pass in data for a single product and get some results. Today, I want to expand that and show how to generate predictions for multiple products.
Setting The Stage
First, let’s load some data into the #InputData table:
DROP TABLE IF EXISTS #InputData;
CREATE TABLE #InputData
(
	ItemID INT,
	PredictionDate DATE,
	ShopperQuestions INT,
	EmployeeRecommendations INT,
	InchesOfPrintAdvertisement INT
);

INSERT INTO #InputData
(
	ItemID,
	PredictionDate,
	ShopperQuestions,
	EmployeeRecommendations,
	InchesOfPrintAdvertisement
)
VALUES
	(1, '2018-01-01', NULL, NULL, NULL),
	(1, '2018-01-02', NULL, NULL, NULL),
	(1, '2018-01-03', NULL, NULL, NULL),
	(1, '2018-01-04', NULL, NULL, NULL),
	(1, '2018-01-05', NULL, NULL, NULL),
	(1, '2018-01-06', NULL, NULL, NULL),
	(1, '2018-01-07', NULL, NULL, NULL),
	(2, '2018-01-01', 8, 5, 14),
	(2, '2018-01-02', 12, 6, 14),
	(2, '2018-01-03', 10, 5, 14),
	(2, '2018-01-04', 8, 6, 14),
	(2, '2018-01-05', 7, 5, 14),
	(2, '2018-01-06', 9, 6, 14),
	(2, '2018-01-07', 15, 5, 14);
Notice that I have seven records for each ItemID, so I want predictions per item for each of those days. This is going to change my prediction function a bit. Previously, I passed in the model (which we store as VARBINARY(MAX)) as a parameter, but now I have two models.
A First Test: Join Models And InputData
The first answer to come to mind is to join the #Model and #InputData temp tables and pass into R a data frame containing the item ID, each prediction date, explanatory features (if required), and the model we want to use. Inside R, I can get the distinct items and models and apply a function to generate predictions.
But it’s not quite that easy. Let’s see what happens when I try to put together a simple data frame:
EXEC sp_execute_external_script
	@language = N'R',
	@script = N'
OutputDataSet <- InputData
',
	@input_data_1 = N'
SELECT
	ItemID,
	Model
FROM #Model',
	@input_data_1_name = N'InputData'
	WITH RESULT SETS
	(
		(
			ItemID INT,
			Model VARBINARY(MAX)
		)
	);
I have my model as an input and want to spit it out at the end as well. But when I try that, I get an error:
Msg 39017, Level 16, State 3, Line 239
Input data query returns column #1 of type ‘varbinary(max)’ which is not supported by the runtime for ‘R’ script. Unsupported types are binary, varbinary, timestamp, datetime2, datetimeoffset, time, text, ntext, image, hierarchyid, xml, sql_variant and user-defined type.
So there goes that plan—I can output a VARBINARY(MAX) model, but I cannot input one.
A Hex On R Services
I can’t pass in binary data, but I can pass in a hex-based textual representation of that binary data, and SQL Server will do that for us. Before we try to do anything fancy with the model, let’s see what we have in R:
EXEC sp_execute_external_script
	@language = N'R',
	@script = N'
print(nrow(InputData));
',
	@input_data_1 = N'
SELECT
	ItemID,
	CONVERT(VARCHAR(MAX), Model, 2) AS Model
FROM #Model',
	@input_data_1_name = N'InputData';
Note that the 2 parameter on the CONVERT function is critical. When converting binary styles, setting the parameter to 1 will give us a hex string starting with “0x” but setting the parameter to 2 will prevent SQL Server from prepending “0x” to our hex stream. That will be important in a moment.
Anyhow, we get our two rows of input data, and now we have to convert that hex string back to binary. That’s one thing that the wkb package does. Let’s take a moment and install the wkb and tidyverse packages, just in case you don’t already have them:
EXEC sys.sp_execute_external_script
	@language = N'R',
	@script = N'install.packages("wkb")
install.packages("tidyverse")'
GO
Now I can use the wkb::hex2raw function to convert an incoming hex string into a raw format that R can use. And this gets us back to where I wanted to be: accepting a model as an input and doing something with that model:
EXEC sp_execute_external_script
	@language = N'R',
	@script = N'library(dplyr)
OutputDataSet <- InputData %>%
					mutate(ModelBinary = wkb::hex2raw(as.character(Model))) %>%
					select(ItemID, ModelBinary)
',
	@input_data_1 = N'
SELECT
	ItemID,
	CONVERT(VARCHAR(MAX), Model, 2) AS Model
FROM #Model',
	@input_data_1_name = N'InputData'
	WITH RESULT SETS
	(
		(
			ItemID INT,
			Model VARBINARY(MAX)
		)
	);
A Basket Of Models
Now that we have figured out the mechanics, it’s time to put together the pieces of the puzzle. I want to join #Model to #InputData and make R do some heavy lifting for me. Let’s first see the code and then I’ll explain it step by step.
EXEC sp_execute_external_script
	@language = N'R',
	@script = N'library(dplyr)
PredictPoisson = function(item_id, model, InputData) {
	lambda <- model
	predictions <- rpois(nrow(InputData), lambda)
	return(data.frame(item_id, InputData$PredictionDate, predictions))
}

PredictLinear = function(item_id, model, InputData) {
	predictions <- round(predict(object = model, newdata = InputData))
	return(data.frame(item_id, InputData$PredictionDate, predictions))
}

MakePrediction = function(item, InputData) {
	model <- unserialize(wkb::hex2raw(as.character(item[2])))
	item_id <- as.numeric(item[1])
	input_data <- InputData %>%
					filter(ItemID == item_id)
	if (class(model)[1] == "Poisson Distribution") {
		print(sprintf("Using the Poisson Distribution for ItemID = %i", item_id))
		return(PredictPoisson(item_id, model, input_data))
	} else {
		print(sprintf("Using a Linear Regression for ItemID = %i", item_id))
		return(PredictLinear(item_id, model, input_data))
	}
}

items <- InputData %>%
			distinct(ItemID, Model) %>%
			select(ItemID, Model)

OutputDataSet <- do.call(rbind, apply(items, 1, MakePrediction, InputData))
',
	@input_data_1 = N'
SELECT
	m.ItemID,
	i.PredictionDate,
	i.ShopperQuestions,
	i.EmployeeRecommendations,
	i.InchesOfPrintAdvertisement,
	CONVERT(VARCHAR(MAX), m.Model, 2) AS Model
FROM #Model m
	INNER JOIN #InputData i
		ON i.ItemID  = m.ItemID',
	@input_data_1_name = N'InputData'
	WITH RESULT SETS
	(
		(
			ItemID INT,
			PredictionDate DATE,
			NumberPredicted INT
		)
	);
Let’s start with the bottom, as that’s most familiar to us. The input data set input_data_1 is just a join of the #Model and #InputData tables. We’re going to have 14 total rows, 7 for ItemID = 1 and 7 for ItemID = 2. Each of those rows will have the model, so we’ll want to pull out the distinct models. In an ideal world, we’d be able to pass multiple input sets into R (and it kind of seems like that was the intent, given the name input_data_1), but we can’t do that today. At the end, I’m defining what I expect the result set to look like: an item ID, a prediction date, and a number predicted. That way I can get the predicted sales per item per day. Now let’s talk about the R code.
Scrolling up to the top of the script, I load the dplyr library so I can use dplyr functions like the pipe. The PredictPoisson and PredictLinear functions are very similar to the previous form, but I added in a new parameter: item_id. My plan is to take the incoming item ID and slap it on the data frame I create. But because there are multiple items, I can’t simply set OutputDataSet inside the predict function like I did last time. Instead, I’m building a separate data frame and returning that, making the calling function combine everything together.
That calling function is MakePrediction. MakePrediction takes two parameters: an item and the InputData data frame. It’s expecting item to be a list with two elements: ItemID as the first element and the hex string model as the second element. I decided to define model and item_id inside the function to make things easier to read. Then, I pulled out the rows from InputData which matter to the item in question. Finally, I have my model type check: if the class of the model is Poisson Distribution, then I want to print out that I’m going to use Poisson for that item and call the PredictPoisson function, returning its resulting data frame to MakePrediction’s caller. If the type is not Poisson, we know it is a linear regression and act accordingly.
Those are the three functions we’ve created. After that, we get to the calling code. First up, I create a data frame called items which is the distinct set of ItemIDs and Models. This is our workaround for not having the ability to pull in multiple data frames, and it works well enough for this case.
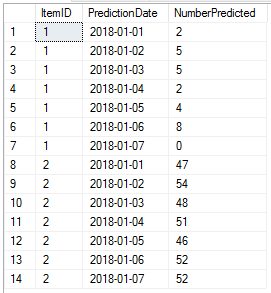
From there, we splice together three R functions to avoid looping through our items data frame. Let’s start from the inside and move out. First, we have the apply function (learn more about apply from Sharon Machlis or Pete Werner). I’m using the apply function to call the MakePrediction function for each row in my items data frame, passing in InputData along the way. Because each call to MakePrediction returns a separate data frame, I need to call the rbind function to concatenate the data frames together. Typically, rbind requires that you list each data frame that you want to combine together. The do.call function figures that part out for me, calling rbind with the appropriate set of data frames. And from there, I get my results:
Conclusion
In this post, we learned two very important things. First, you cannot use VARBINARY or BINARY as an input to an R script in SQL Server Machine Learning Services. You can, however, convert that binary to hex, pass it in as a string, and convert it back to binary using the wkb library.
Second, using a bit of functional programming mojo, we can perform the equivalent of several foreach loops in one line of code—and in R, these set-based operations tend to be faster than their iterative equivalents.
This wraps up my series on modeling in Machine Learning Services. The code in this series isn’t up to production quality, of course (particularly around error handling), but I hope it gives you enough to see how you can integrate SQL and R.

One thought on “Passing VARBINARY Models Into ML Services”