Today, we’re going to continue our Polybase training regimen and hopefully get one step closer to beating the query that stopped us before. This time around, we’re going to look at some of the information SQL Server offers us on external tables to see if there’s something that might be helpful.
DMVs Everywhere
SQL Server surfaces a number of external table DMVs, and these seem like a good place to start.
The Basics
We’re going to start with some basic information:

The sys.external_tables, sys.external_data_sources, and sys.external_file_formats tables give us basic information on tables, data sources, and file formats. This is useful information to be sure, but won’t help us in our quest.
Compute Nodes
There are a couple of compute node queries which just provide basic information: sys.dm_exec_compute_nodes and sys.dm_exec_compute_node_status.
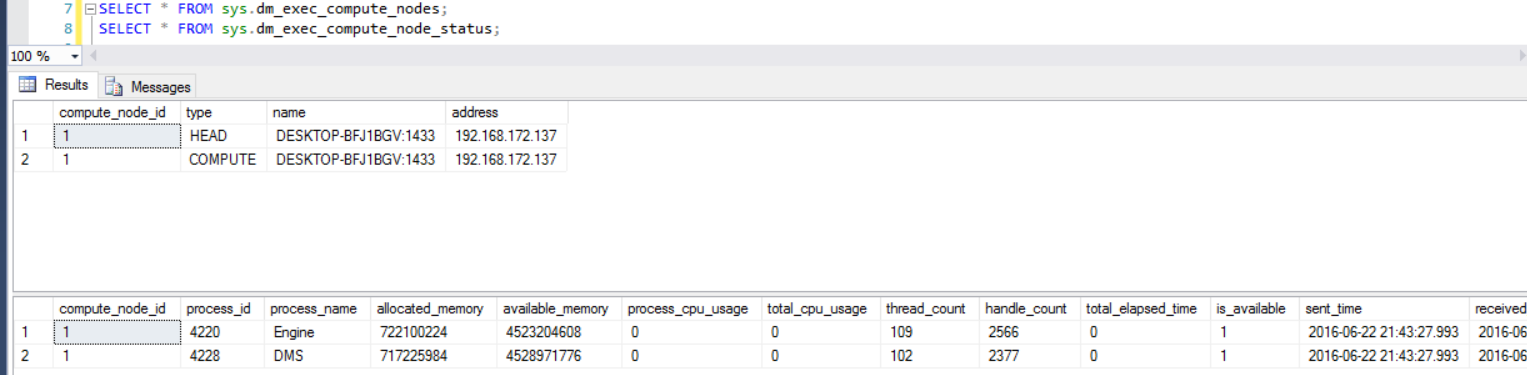
For my simple VM example, this is kind of boring, but if you have several SQL Server compute nodes, you can see which nodes are currently running.
Current Operations
There are several DMVs which are tied to current operations. These include:
sys.dm_exec_distributed_requests
The sys.dm_exec_distributed_requests DMV “holds information about all requests currently or recently active in PolyBase queries.” Let’s see how it looks when we run it:
SELECT
	r.sql_handle,
	t.text,
	r.execution_id,
	r.status,
	r.error_id,
	r.start_time,
	r.end_time,
	r.total_elapsed_time
FROM sys.dm_exec_distributed_requests r
	OUTER APPLY sys.dm_exec_sql_text(r.sql_handle) t;
Here are the results, including text whenever we have a valid SQL handle.

There are a couple of things to note here. First, not all handles tie to text; I believe some of those got aged out because I can tell based on the elapsed time that some of them are CMH queries that we ran a few days ago. Second, while I snapped that screenshot, I was running a query which pulled all O’Hare data, so you can grab currently-running queries. Thirdly, some Polybase DMV queries are apparently distributed requests, so if you do decide to put monitoring around this DMV, you might want to try to avoid conflating “real” external queries from those DMVs if you can.
This is the Polybase equivalent of sys.dm_exec_requests, so it’s helpful in seeing what’s going on at the moment, but has a benefit in that it does keep some history longer than just the last query for a session.
sys.dm_exec_distributed_request_steps
The requests DMV gives us high-level information, but if we want to dig a little deeper, dm_exec_distributed_request_steps is our DMV of choice.
In this case, I’m going to look at the O’Hare query that we just ran. Its execution ID is QID652.
SELECT
	r.*
FROM sys.dm_exec_distributed_request_steps r
WHERE
	r.execution_id = 'QID652'
ORDER BY
	start_time ASC;
And here’s what it looks like, all 9 steps:

Let’s walk through this one step at a time and understand what the DMV is telling us. Unfortunately, the DMV documentation is a little sparse, so some of this is guesswork on my part.
- A RandomIDOperation appears to create a temporary table. In this case, the table (whose name is randomly generated) is named TEMP_ID_53. I’m not sure where that name comes from; the session I ran this from was 54, so it wasn’t a session ID.
- After the table gets created, each Compute node gets told to create a table called TMP_ID_53 in tempdb whose structure matches our external table’s structure. One thing you can’t see from the screenshot is that this table is created with DATA_COMPRESSION = PAGE. I have to wonder if that’d be the same if my Compute node were on Standard edition.
- We add an extended property on the table, flagging it as IS_EXTERNAL_STREAMING_TABLE.
- We then update the statistics on that temp table based on expected values. 629 rows are expected here.
- Then, we create the dest stat, meaning that the temp table now has exactly the same statistics as our external table.
- The next step is that the Head node begins a MultiStreamOperation, which tells the Compute nodes to begin working. This operator does not show up in the documentation, but we can see that the elapsed time is 58.8 seconds, which is just about as long as my query took. My guess is that this is where the Head node passes code to the Compute nodes and tells them what to do.
- We have a HadoopRoundRobinOperation on DMS, which stands for “Data Movement Step” according to the location_type documentation. What’s interesting is that according to the DMV, that operation is still going. Even after I checked it 40 minutes later, it still claimed to be running. If you check the full query, it’s basically a SELECT * from our external table.
- Next is a StreamingReturnOperation, which includes our predicate WHERE dest = ‘ORD’ in it. This is a Data Movement Step and includes all of the Compute nodes (all one of them, that is) sending data back to the Head node so that I can see the results.
- Finally, we drop TEMP_ID_53 because we’re done with the table.
This DMV is very helpful for figuring out which individual steps take the longest. In our case here, the entirety of the query time was spent grabbing data from Hadoop and passing it back to the Head node.
Someone who knows what they’re doing really should provide some more details here, as sadly, this will be the first blog post in which some of those operators above appear, and I’ll be the first to admit that I’m shooting from the hip on this.
sys.dm_exec_distributed_sql_requests
The sys.dm_exec_distributed_sql_requests DMV is pretty simple: it keeps track of what SQL Server is doing during various Polybase requests. When I ran my O’Hare query, there were five SQL Server related steps: create a temp table, set an extended property, update stats on the temp table, create my custom stat on the temp table, and drop the temp table. Here’s what my query looks like:
SELECT
	r.*
FROM sys.dm_exec_distributed_sql_requests r
WHERE
	r.execution_id = 'QID652'
ORDER BY
	step_index,
	compute_node_id,
	distribution_id;
And here’s the result set:

To be honest, I only expected one row per step, and yet I have 8 rows per step. To understand why, we need to look at the execution plan for this query. Specifically, we need to read the XML in the Remote Query section of the properties.

Inside there, we see some XML that starts with:
<?xml version="1.0" encoding="utf-8"?>
<dsql_query number_nodes="1" number_distributions="8" number_distributions_per_node="8">
The number_distributions_per_node appears to control that level of intra-node concurrency but I’m not sure how you can control that with Polybase; maybe it’s a built-in machine setting.
sys.dm_exec_external_work
Another interesting-looking DMV is sys.dm_exec_external_work, which gives us a one-line explanation of Polybase queries.

In this example, I have two query calls from separate databases. The SecondBasemen input completed, and the 1987 file is in progress so end_time is currently NULL. I think that bytes_processed / length might give us a rough go at our current percent completion.
Data Movement Step DMVs
There are a couple of DMVs dedicated to understanding what’s going on with Data Movement Step (DMS) processes.
sys.dm_exec_dms_services
The sys.dm_exec_dms_services DMV tells us the Data Movement Step (DMS) nodes—that is, our SQL Server compute nodes.
sys.dm_exec_dms_workers
Tied to the DMS services, the sys.dm_exec_dms_workers DMV shows data for the last 1000 requests, as well as active requests. This does tell you bytes/sec, bytes processed, and rows processed, which could be helpful in tracing down slow steps.
Conclusion
There are a number of useful DMVs that can help us figure out what’s going on with our Polybase queries. Unfortunately, there’s not a huge amount of information on them at the present; hopefully that changes over time as more people dig into Polybase.

3 thoughts on “Learning More About Polybase DMVs”